 百木园
百木园房价数据分析
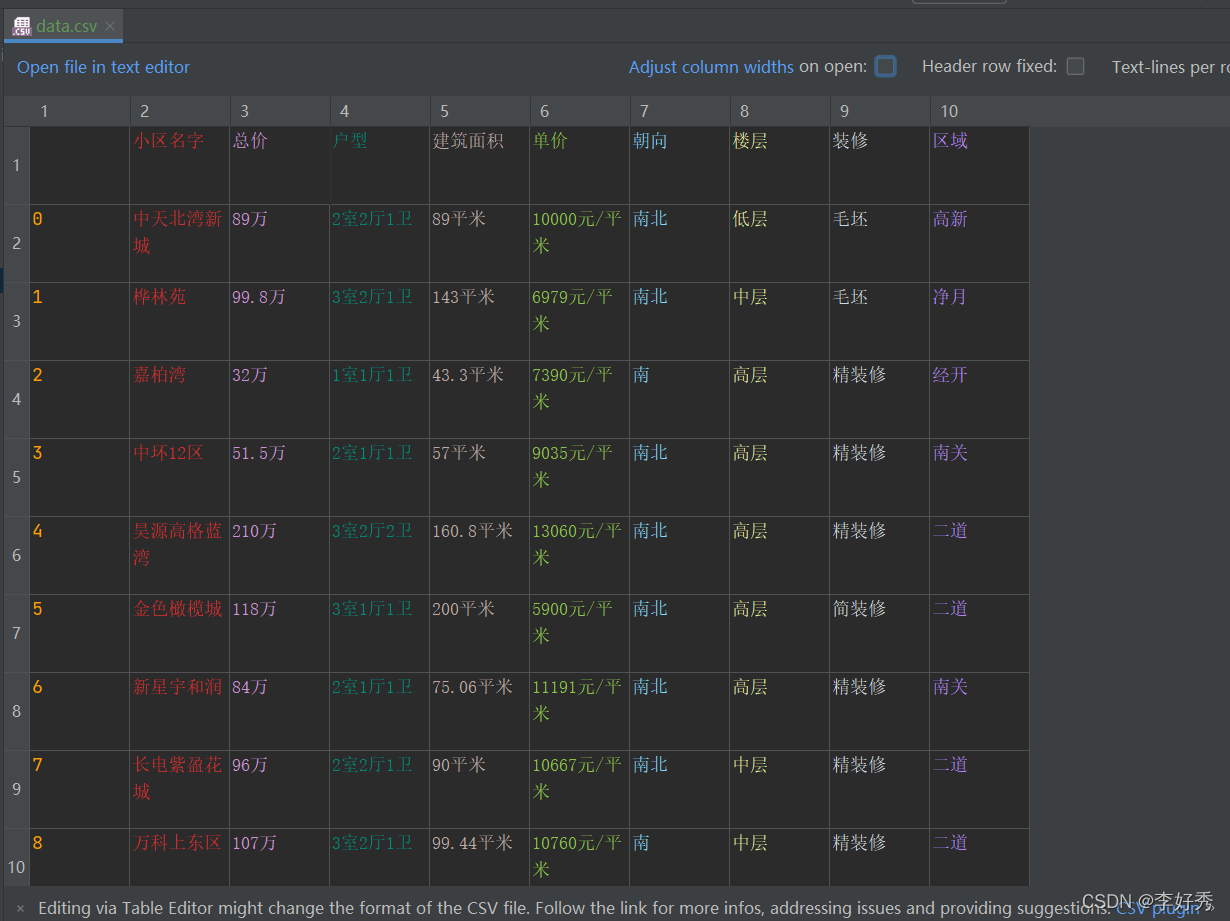
数据简单清洗
data.csv
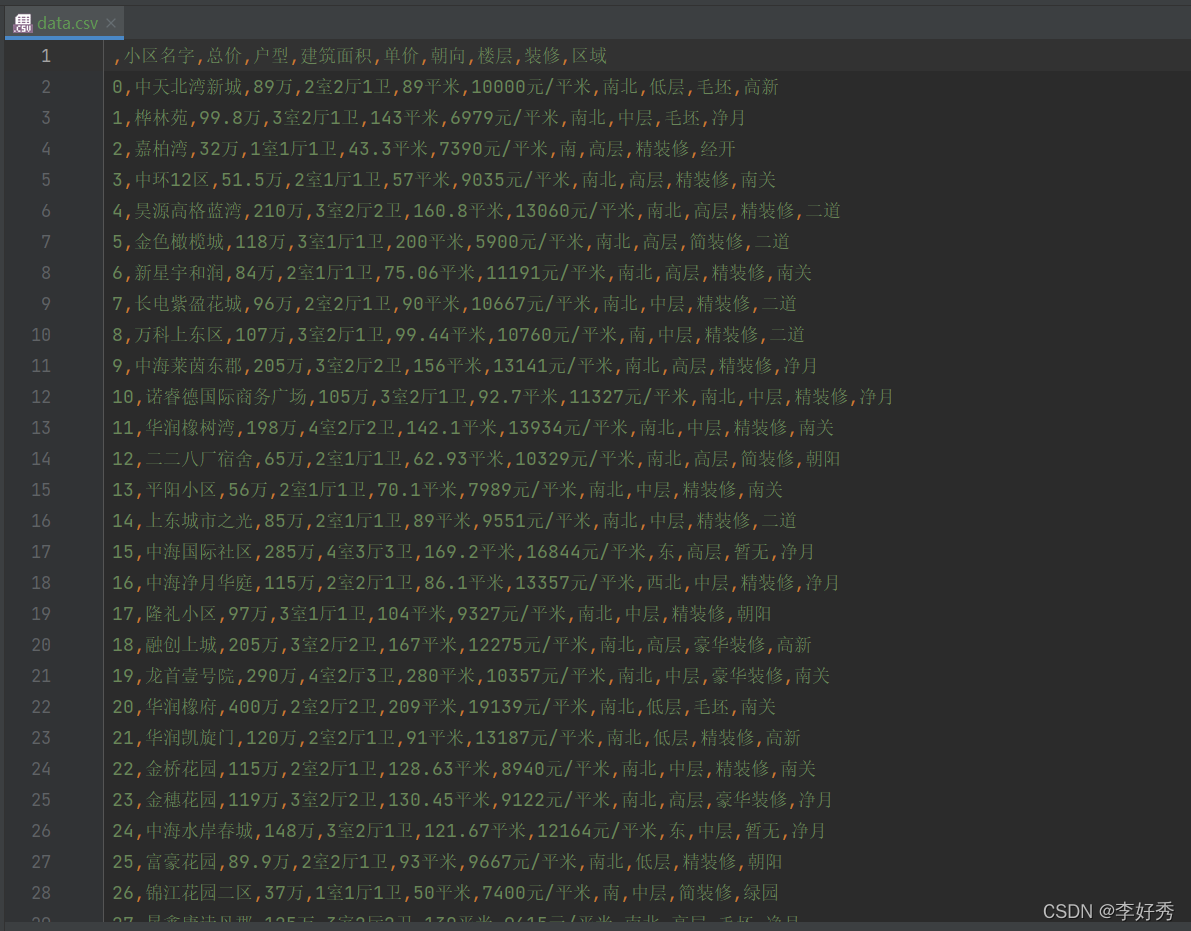
数据显示
# 导入模块
import pandas as pd # 导入数据统计模块
import matplotlib # 导入图表模块
import matplotlib.pyplot as plt # 导入绘图模块
# 避免中文乱码
matplotlib.rcParams[\'font.sans-serif\'] = [\'SimHei\'] # 设置字体为SimHei显示中文
matplotlib.rcParams[\'axes.unicode_minus\'] = False # 设置正常显示字符,使用rc配置文件来自定义
# 简单清洗
data = pd.read_csv(\'data.csv\') # 读取csv数据
del data[\'Unnamed: 0\'] # 将索引列删除
data.dropna(axis=0, how=\'any\', inplace=True) # 删除data数据中的所有空值
data[\'单价\'] = data[\'单价\'].map(lambda d: d.replace(\'元/平米\', \'\')) # 将单价“元/平米”去掉
data[\'单价\'] = data[\'单价\'].astype(float) # 将房子单价转换为浮点类型,float(data[\'\',单价])
data[\'总价\'] = data[\'总价\'].map(lambda d: d.replace(\'万\', \'\')) # 将总价“万”去掉
data[\'总价\'] = data[\'总价\'].astype(float) # 将房子总价转换为浮点类型,float(data[\'\',单价])
data[\'建筑面积\'] = data[\'建筑面积\'].map(lambda p: p.replace(\'平米\', \'\')) # 将建筑面积“平米去掉”
data[\'建筑面积\'] = data[\'建筑面积\'].astype(float) # 将将建筑面积转换为浮点类型
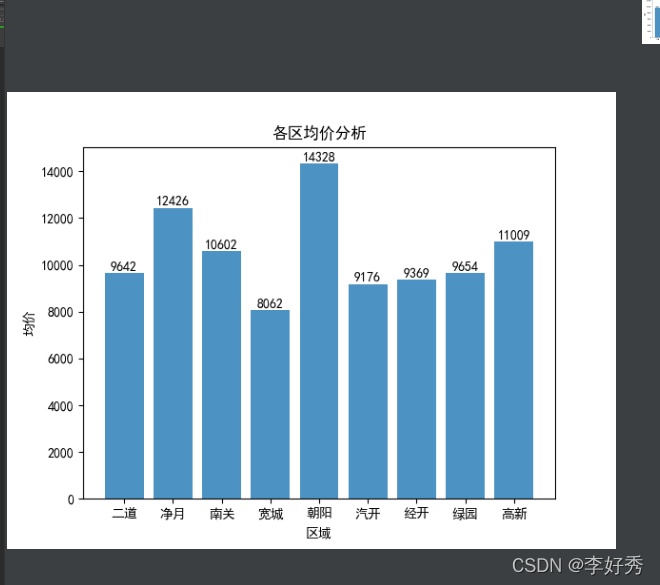
各区均价分析
# 获取各区二手房均价分析,根据需求,,进一步处理数据,如果要写相应算法,需要根据算法所需求的数据处理
def get_average_price():
group = data.groupby(\'区域\') # 将房子区域分组
average_price_group = group[\'单价\'].mean() # 计算每个区域的均价,average_price_group字典
x = average_price_group.index # 区域
y = average_price_group.values.astype(int) # 区域对应的均价a =[\'t\':\'123\'] a.keys()
return x, y # 返回区域与对应的均价,region二关 average_price均价
# 显示均价条形图
def average_price_bar(x, y, title):
plt.figure() # 图形画布
plt.bar(x, y, alpha=0.8) # 绘制条形图
plt.xlabel(\"区域\") # 区域文字
plt.ylabel(\"均价\") # 均价文字
plt.title(title) # 表标题文字
# 为每一个图形加数值标签
for x, y in enumerate(y):
plt.text(x, y + 100, y, ha=\'center\')
plt.show()
if __name__ == \'__main__\':
x, y = get_average_price()
title = \'各区均价分析\'
average_price_bar(x, y, title)
运行如图
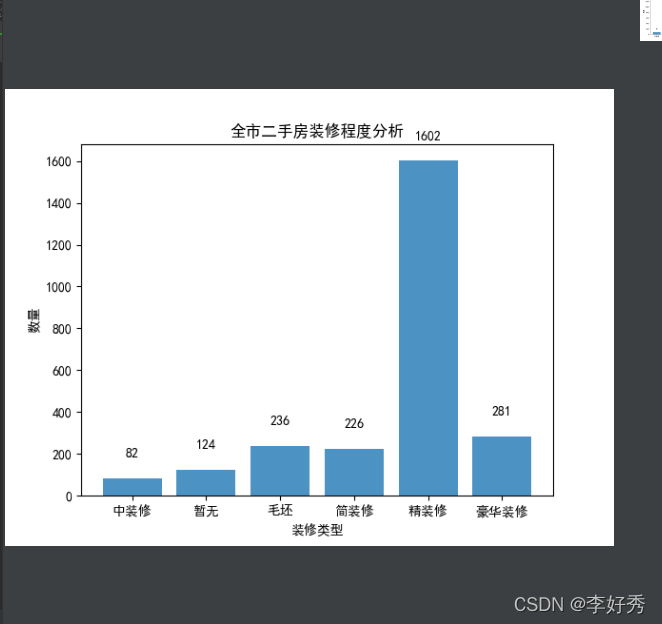
全市二手房装修程度分析
# 获取各区二手房均价分析,根据需求,,进一步处理数据,如果要写相应算法,需要根据算法所需求的数据处理
def get_decorate_sum():
group = data.groupby(\'装修\') # 将房子区域分组
# decorate_sum_group = group[\'装修\'].count() # 计算每个区域的均价,average_price_group字典
decorate_sum_group = group.size() # 计算每个区域的均价,average_price_group字典
x = decorate_sum_group.index # 区域
y = decorate_sum_group.values.astype(int) # 区域对应的均价a =[\'t\':\'123\'] a.keys()
return x, y # 返回区域与对应的均价,region二关 average_price均价
# 显示均价条形图
def average_price_bar(x, y, title):
plt.figure() # 图形画布
plt.bar(x, y, alpha=0.8) # 绘制条形图
plt.xlabel(\"装修类型\") # 区域文字
plt.ylabel(\"数量\") # 均价文字
plt.title(title) # 表标题文字
# 为每一个图形加数值标签
for x, y in enumerate(y):
plt.text(x, y + 100, y, ha=\'center\')
plt.show()
if __name__ == \'__main__\':
x, y = get_decorate_sum()
title = \'全市二手房装修程度分析\'
average_price_bar(x, y, title)
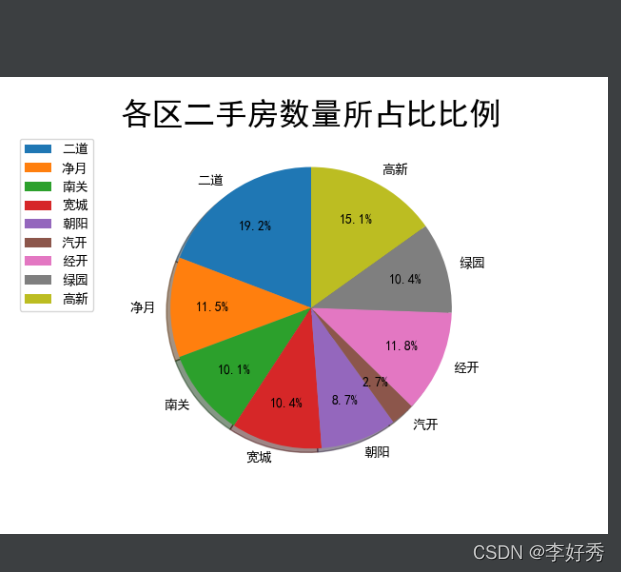
各区二手房数量所占比比例
# 获取各区二手房各区比例数量,进一步处理数据,如果要写相应算法,需要根据算法所需求的数据处理
def get_proportional_quantity():
area = data[\'区域\'].groupby(data[\'区域\']).count() # 将房子区域分组比例数量
areaName = (area).index.values # 将房子区域分组比例取名
return area, areaName
# 显示均价条形图
def proportional_quantity_pie(area, areaName, title):
plt.figure() # 图形画布
plt.pie(area, labels=areaName, labeldistance=1.1, autopct=\'%.1f%%\',
shadow=True, startangle=90, pctdistance=0.7)
plt.title(title, fontsize=24) # 表标题文字
plt.legend(bbox_to_anchor=(-0.1, 1)) # 作者标题
plt.show()
if __name__ == \'__main__\':
# 对应x,y
area, areaName = get_proportional_quantity()
title = \'各区二手房数量所占比比例\'
proportional_quantity_pie(area, areaName, title)
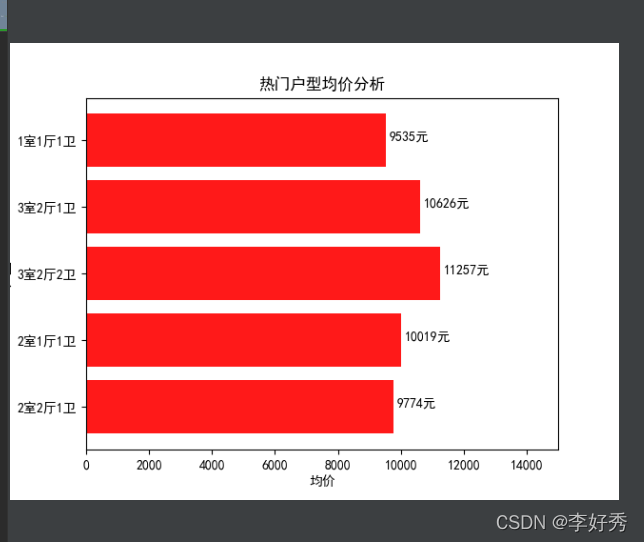
热门户型均价分析
# 获取各区热门户型分析,根据需求,,进一步处理数据,如果要写相应算法,需要根据算法所需求的数据处理
def get_hot_portal():
# 另外一种方法获取并取值
\"\"\"
group = data.groupby(\'户型\').size # 将房子区域分组
sort_data = group.sort_values(ascending=False) # 将户型分组数量进行降序
five_data = sort_data.head() # 提取前5组户型数据
house_type_mean = data.groupby(\'户型\')[\'单价\'].mean().astype(int) # 计算每个户型的均价
x = house_type_mean[five_data.index].index # 户型
y = house_type_mean[five_data.index].value # 户型对应的均价
\"\"\"
group = data.groupby(\'户型\') # 将房子区域分组
a = group[\'户型\'].count().sort_values(ascending=False).head() # 计算每个户型的均价 字典
b = group[\'单价\'].mean()[a.index] # 区域对应的均价a =[\'t\':\'123\'] a.keys()
x = b.index
y = b.values.astype(int)
return x, y # 返回区域与对应的均价,region二关 average_price均价
# 显示均价横条形图
def hot_portal_barh(x, y, title):
plt.figure() # 图形画布
plt.barh(x, y, alpha=0.9, color=\'red\') # 绘制条形图
plt.xlabel(\"均价\") # 区域文字
plt.ylabel(\"户型\") # 均价文字
plt.title(title) # 表标题文字
plt.xlim(0, 15000) # X轴的大小
# 为每一个图形加数值标签
for y, x in enumerate(y):
plt.text(x + 100, y, str(x) + \'元\', ha=\'left\')
plt.show()
if __name__ == \'__main__\':
x, y = get_hot_portal()
title = \'热门户型均价分析\'
hot_portal_barh(x, y, title)
前面三个图较简单,最后相对于前面三个较为麻烦
先获取得到热门户型前五名,通过户型得到对应的户型的平均值
GitHub下载地址
CrawlerPractice
来源:https://www.cnblogs.com/lehoso/p/15634923.html
图文来源于网络,如有侵权请联系删除。