 百木园
百木园了解 matplotlib 的坐标系统,绘制图形的时候,如果需要在图上添加一些额外的元素或者说明文字,
就可以很好的控制添加元素和说明文字的位置。
笛卡尔坐标系和极坐标系
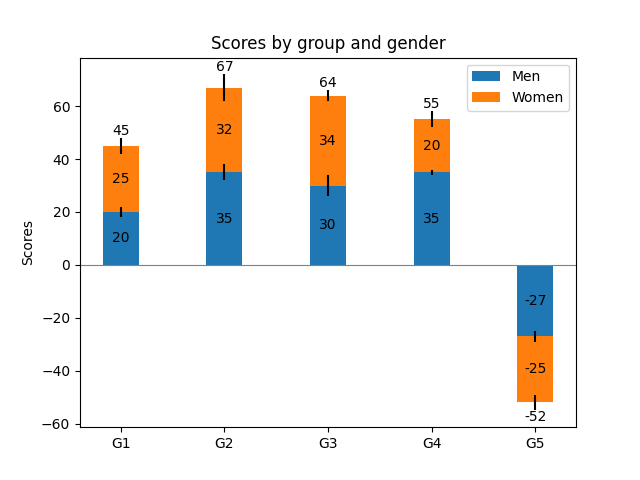
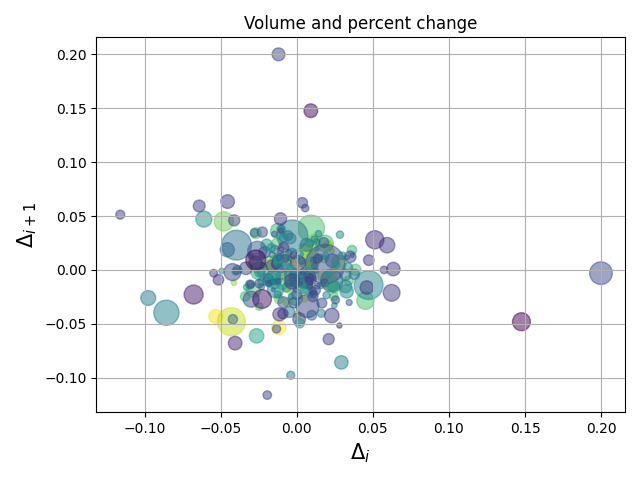
matplotlib 使用2种坐标系,笛卡尔坐标系是默认的,一般我们绘制的二维图形基本都是笛卡尔坐标系的。
比如各种柱状图,折线图,散点图等等。
但是,有些场景下,极坐标能更好的展示分析的结果。
比如上面笛卡尔坐标系下的柱状图,折线图和散点图在极坐标系下显示效果类似:
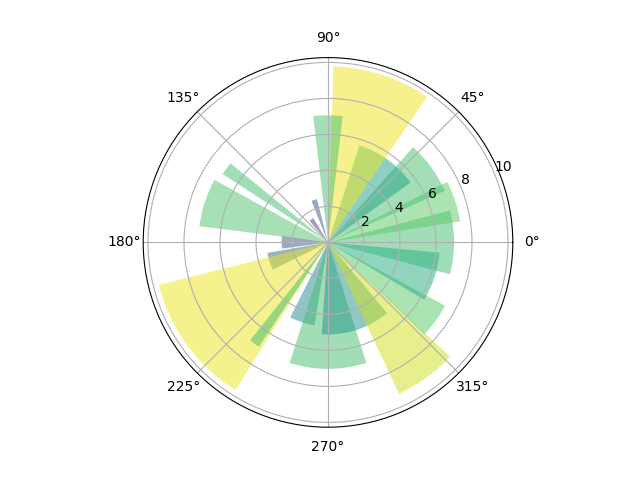
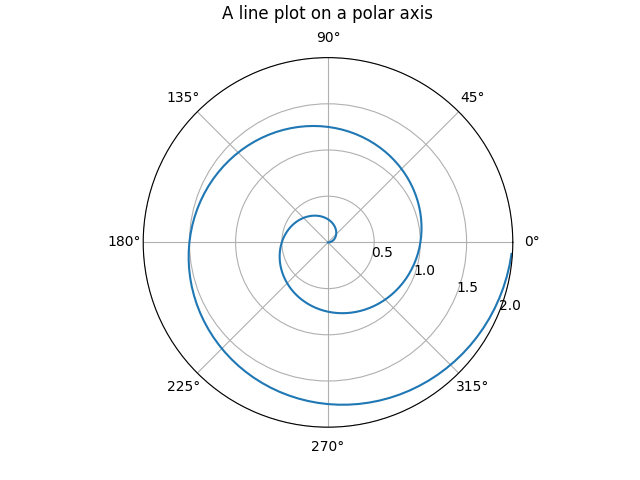
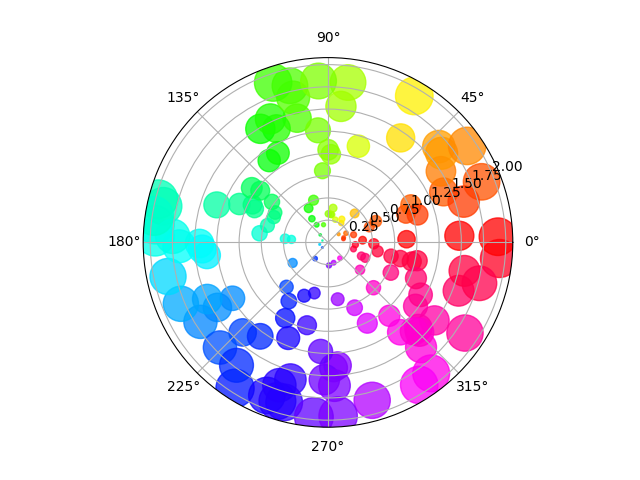
两种坐标系没有高低之分,根据场景选择合适的去展示。
图形中的坐标系
笛卡尔坐标系和极坐标系是宏观上的坐标系统,对于每个具体的图形,matplotlib 为了更好的在图形上绘制各种元素,
基于笛卡尔坐标系或者极坐标系,定义了绘制图形的4个坐标系:
在笛卡尔坐标系下:

在极坐标系下:

图形中坐标系之间的转换
matplotlib 提供了接口,可以在4种坐标系之间的坐标是可以互相转换的。
对于如下的示例图形,提供的6种坐标系之间的转换接口如下:
fig = plt.figure(figsize=(6, 5), dpi=100)
ax = fig.add_subplot(1, 1, 1)
ax.set_xlim(0,360), ax.set_ylim(-1,1)
| DC_to_FC | ax.transData.transform |
| FC_to_DC | ax.transData.inverted().transform |
| NDC_to_FC | ax.transAxes.transform |
| FC_to_NDC | ax.transAxes.inverted().transform |
| NFC_to_FC | fig.transFigure.transform |
| FC_to_NFC | fig.transFigure.inverted().transform |
一共4种坐标系,如果两两之间都可以互相转换,应该有12种情况,这里却只有6种情况。
这是因为其他的情况可以由上面这6种接口推导出来,比如:
下面,用github上一段开源代码示例看看转换的结果:
# ----------------------------------------------------------------------------
# Title: Scientific Visualisation - Python & Matplotlib
# Author: Nicolas P. Rougier
# License: BSD
# ----------------------------------------------------------------------------
import numpy as np
import matplotlib.pyplot as plt
import matplotlib.transforms as transforms
fig = plt.figure(figsize=(6, 5), dpi=100)
ax = fig.add_subplot(1, 1, 1)
ax.set_xlim(0, 360)
ax.set_ylim(-1, 1)
DC_to_FC = ax.transData.transform
FC_to_DC = ax.transData.inverted().transform
NDC_to_FC = ax.transAxes.transform
FC_to_NDC = ax.transAxes.inverted().transform
NFC_to_FC = fig.transFigure.transform
FC_to_NFC = fig.transFigure.inverted().transform
print(NFC_to_FC([1, 1])) # (600,500)
print(NDC_to_FC([1, 1])) # (540,440)
print(DC_to_FC([360, 1])) # (540,440)
DC_to_NDC = lambda x: FC_to_NDC(DC_to_FC(x))
print(DC_to_NDC([0, -1])) # (0.0, 0.0)
print(DC_to_NDC([180, 0])) # (0.5, 0.5)
print(DC_to_NDC([360, 1])) # (1.0, 1.0)
来源:https://www.cnblogs.com/wang_yb/p/15942291.html
图文来源于网络,如有侵权请联系删除。